Quick answer: Prices for cars like yours move every month — up, flat or down. The Price Trend card on your AutoKnowMus Seller dashboard shows which way they are moving and how strongly. Use it to decide where inside your fair range to set your price: higher when prices are rising, nearer the middle when they are soft. A price is only right for the market it was set in, so check the trend before you set your price, and again before you change it.
What this post covers
Why a price that was right a few months ago can quietly go stale. How to read the Price Trend card on your Seller dashboard. What each of its five readings means for your price. And a pulse check at the end that tells you whether your price is current. If you have not read it yet, throw away the price in your head sits underneath this one.
Nobody sells gold at last year's rate.
Think about it. Before anyone walks into a jeweller's shop to sell a chain or a bangle, they check one thing first: today's gold rate. Not the rate from their wedding. Not the rate a cousin got last Diwali. Today's. Because everyone knows the rate moves, and selling at an old rate means either losing money or walking out with no deal.
Now think about how most people price a car.
They look at a few ads one evening. They hear what a neighbour got. A figure settles in their head. And then that figure stays there — for weeks, sometimes months — while the market it came from quietly moves on.
Gold has a board outside every shop showing today's rate. Your car never had one.
Until now. It is sitting on your Seller dashboard, and it is called Price Trend.
The price that went stale
Let me tell you about a seller I have met a hundred times in this trade.
They set their price in spring. And it was a good price — right in the middle of what cars like theirs were fetching. Fair, sensible, defendable.
Then life got busy. The ad stayed up. Summer came, then the monsoon, then a new version of their car's model arrived with new looks. Cars like theirs drifted down, a little each month.
By autumn, the same price was still on the ad. And the phone had gone quiet.
The car had not changed. Same kilometers, almost. Same condition. Same owner. What changed was everything around the car. The price was right — for spring. Nobody was buying in spring anymore.
It works the other way too, and this one hurts just as much. A seller sets a price from old information while cars like theirs are quietly rising. The first buyer agrees in two minutes, without a single question. And the seller spends the next year wondering why it was so easy.
Both sellers made the same mistake. They priced the car once, and then stopped watching the market.
Your rate board: the Price Trend card
Open your Seller dashboard and look at the row called Market Indicators. Four cards sit side by side. The second one is the one this post is about.

The Market Indicators row. One car's screen — yours will show its own readings.
The Price Trend card answers one question: which way are prices moving for a car like yours, and how strongly?
It shows you three things at a glance:
- An arrow — up means prices are rising, down means falling, a flat line means steady.
- A percentage — how big the movement is.
- A plain line underneath — the movement in words, like "Market prices slightly rising."
That is it. No jargon, no chart to decode. Direction, size, and a sentence.
Why we put this card on your screen
Your fair value tells you what your car is worth. The Price Trend tells you which way the market around it is moving. You need both. A seller with only the first knows where they stand today. A seller with both knows where to stand inside that range — and when their price needs a fresh look.
The five readings — and what each means for your price
Tap the small i next to Price Trend and the card explains itself. Every reading falls into one of five bands.
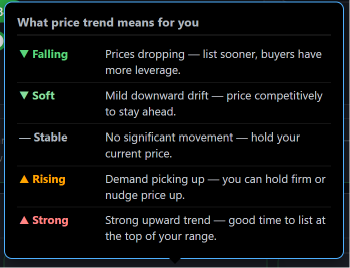
The five Price Trend readings, as the dashboard explains them.
Here is what each reading means when you are the one selling. Notice the pattern: the trend never changes what your car is worth. It changes where inside your fair range you should stand.
▼ Falling. Prices for cars like yours are dropping, and buyers know they have choices. Start near the middle of your fair range — not the top, and not from the figure you had in your head last season. Judge every offer against today's fair value, and re-check it often, because it is moving.
▼ Soft. A mild downward drift. Nothing dramatic, but buyers are comparing carefully. Price competitively inside your range, so your car is the one they want to see first, not the one they keep for later.
— Stable. No real movement. This is the calmest reading of all. Hold your price. There is no reason to chase it up or cut it down — the market is not asking you to do either.
▲ Rising. Demand is picking up for cars like yours. You can hold firm with confidence, and a small nudge upward inside your fair range is reasonable. Don't undersell your car on old information.
▲ Strong. A clear upward movement. The top of your fair range is within reach and defendable. This is the reading where sellers most often leave money behind — by pricing from a figure they settled on months ago.
| Price Trend reading | What the market is doing | Where to stand in your fair range |
|---|---|---|
| ▼ Falling | Prices for cars like yours dropping | Near the middle; judge offers against today's value |
| ▼ Soft | A mild downward drift | Competitive; don't sit at the top |
| — Stable | No real movement | Hold your price |
| ▲ Rising | Demand picking up | Hold firm; a small nudge up is fair |
| ▲ Strong | Clear upward movement | The top of your range is defendable |
Don't add the percentage to your price
If the card shows prices rising by a few percent, that does not mean you add that percentage to your figure. The trend is a direction, not a top-up. It tells you where inside your fair range to stand — it never takes you outside it.
Why prices move at all
Anyone who has worked in a factory knows that when something changes on the line, you walk back and find the station that caused it. Prices are no different. When the arrow moves, one of seven things is usually behind it.
1. People. Sellers move in waves. When many owners decide to upgrade at once, more cars like yours come up for sale, and prices feel the pressure.
2. New models. A fresh version arrives with new looks or features. The older version suddenly feels older — and its prices drift.
3. Supply. How many cars like yours are up for sale right now. Fewer cars, more pull. More cars, more choice for the buyer. The Your car vs the market panel on the same dashboard shows you this side of the story.
4. Method. How a buyer is paying. When car loans get easier or harder, buyers' budgets stretch or shrink — and prices follow.
5. Measurement. What buyers are comparing you against. When new cars get pricier, good used ones look like better value, and their prices can firm up.
6. Rules and costs. Fuel prices, road rules for older vehicles in some cities, insurance costs. These often move one fuel type or one age group, not everything at once.
7. Season. Festivals, the year-end, the new financial year, the monsoon. Some months bring more buyers out; some bring more sellers.
You don't need to know which of the seven is at work to use the card. But when you can name one, the arrow stops feeling like magic and starts feeling like information.
Six questions every time you open the card
Make this a habit. Ninety seconds, every time you look at your dashboard.
What does the arrow say — rising, stable or falling?
How strong is it — a slight drift, or a clear move?
Why might it be moving — a season, a new model, a wave of sellers?
When did I last check — and has the reading changed since I set my price?
Where does my asking price sit inside my fair range — and does that match the reading?
Who else is selling — how many cars like mine are up for sale right now?
If your answer to when is "the day I first priced it," your price is running on an old rate.
Price, condition, speed — the trend changes the trade
Every sale trades three things: the price you get, the condition you present, and the speed of the sale. You can rarely have the best of all three. The Price Trend tells you which one the market is making easier or harder right now.
When prices are rising, the market is on your side. You can hold your price and still expect interest, as long as the condition matches what you are asking.
When prices are stable, all three are in balance. Present the car well, price it sensibly, and let it take the time it takes.
When prices are soft or falling, holding all three at once gets harder. This is when condition earns its keep — a clean car with a full service record stands out when buyers are comparing carefully. And it is when you decide, at home and in advance, which of the three you are willing to give a little on.
The trend does not make that decision for you. It tells you what the decision is.
Six things a current price has
Put your asking price next to this list.
Present — it was set after you last checked the trend, not before. Positioned — it sits where the trend says it should inside your fair range. Peers — it matches cars like yours, not cars in general. Place — it suits your city, where your buyer actually is. Proof — you can point to your dashboard and show where it came from. Periodic — you re-check it every couple of weeks, not once.
A price with all six is not a guess. It is today's rate.
The short version
| The old way | The pulse way |
|---|---|
| Set a price once | Set it, then re-check every couple of weeks |
| Price from a figure in your head | Price from your fair value plus today's trend |
| Same price in a rising or falling market | Stand higher or lower in your range as the trend moves |
| Notice the market only when the phone goes quiet | Notice it on your dashboard first |
| Add the trend percentage to your price | Use the trend to choose a position inside your range |
Check your car's pulse
Eight quick checks. Tick only what you can honestly say yes to. Your verdict appears at the bottom.
Check your car's pulse
Is your price set for today's market? No sign-up. Nothing is saved.
Start ticking.
Your verdict appears here as you go.
This check tests whether your price is current — never what your car is worth. Your Seller dashboard answers that.
Reading your verdict:
- 1 to 3 ticks — your price may be stale. Open your dashboard before you talk to another buyer.
- 4 to 6 ticks — due for a re-check. You know part of the picture; fill the gaps.
- 7 to 8 ticks — your price is current. Keep the habit and it stays that way.
Why this matters to us at AutoKnowMus
Gold sellers have always had something car sellers never had: a rate on a board, the same for everyone who walks past. Nobody argues with the board. They just check it before they sell.
That is what we are building for cars. Your fair value is the rate for your exact car. The Price Trend shows which way that rate is moving. And both are the same for the seller and the buyer — because we do not buy cars, we do not sell them, we do not list them, and not one rupee of ours moves when your deal closes.
We read ads only to see which way the market is moving, never to set what your car is worth. Your fair value comes from your car's own facts: make, model, year, variant, owners, kilometers and condition. Here is how we work it out. The verdict is never for sale.
Check the rate before you sell the gold. Check your car's pulse before you set the price.
FAQs
What does Price Trend mean on the AutoKnowMus Seller dashboard?
It shows which way prices are moving for a car like yours, and how strongly — as an arrow, a percentage and a plain line such as "Market prices slightly rising." Every reading falls into one of five bands: Falling, Soft, Stable, Rising or Strong. Use it to decide where inside your fair range to set your price.
If prices are rising, should I add that percentage to my asking price?
No. The trend is a direction, not a top-up. A rising reading means you can hold firm, or nudge your price upward inside your fair range. It never takes your price outside that range.
What should I do if the Price Trend shows prices falling?
Price near the middle of your fair range rather than the top, and judge every offer against today's fair value — not the figure you had in mind months ago. Re-check your dashboard more often, because the value is moving. Condition matters more in a soft market, so present the car at its best.
How often should I check the price trend for my car?
Every couple of weeks while you are selling, and always before you change your price. A price set for one month's market can be out of step a few months later, even if nothing about the car has changed.
Why do used car prices go up and down?
Usually because of one of a handful of things: waves of sellers upgrading at once, a new version of a model arriving, how many similar cars are for sale, how easy car loans are, the price of new cars, fuel prices and road rules, and the season. Most of these affect some cars more than others, which is why the trend is shown for a car like yours.
Write down your asking price and the date you set it. Now open your Seller dashboard and read the Price Trend. If the reading has changed since that date, your price was set for a market that no longer exists — and today is when you fix that.